Edit chart
Loading graph
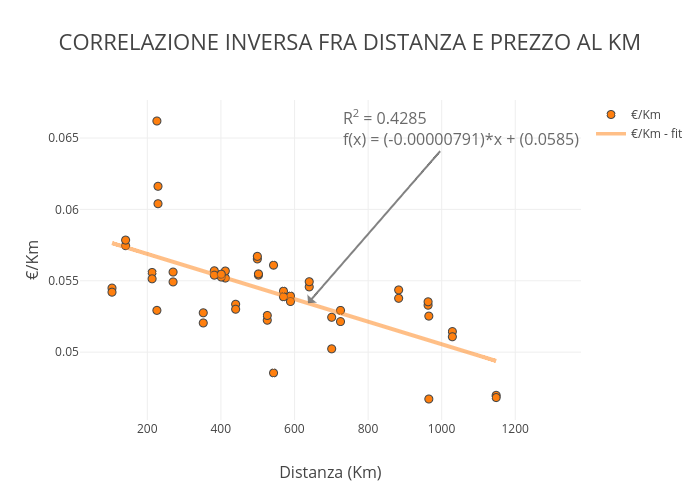
Micheleferrucci's interactive graph and data of "CORRELAZIONE INVERSA FRA DISTANZA E PREZZO AL KM" is a scatter chart, showing €/Km vs €/Km - fit; with Distanza (Km) in the x-axis and €/Km in the y-axis.. The x-axis shows values from 35.00056893608951 to 1216.9994310639104. The y-axis shows values from 0.04534277014124458 to 0.06756490386321756. This visualization has the following annotation: R2 = 0.4285f(x) = (-0.00000791)*x + (0.0585)