Edit chart
Loading graph
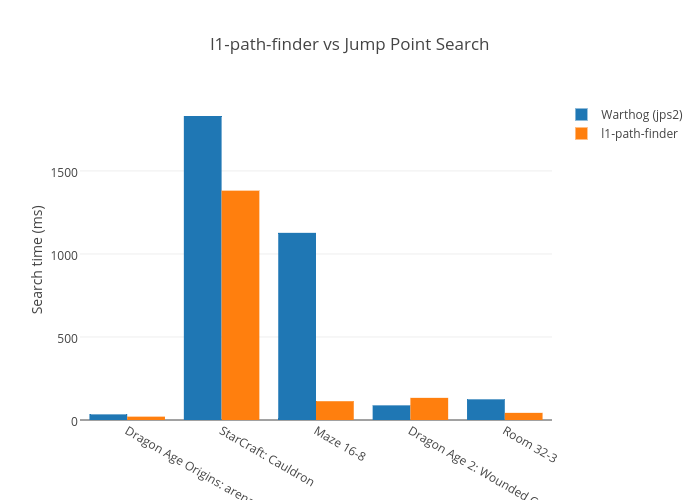
Mikolalysenko's interactive graph and data of "l1-path-finder vs Jump Point Search" is a bar chart, showing Warthog (jps2) vs l1-path-finder; with Search time (ms) in the y-axis. The x-axis shows values from -0.5 to 4.5. The y-axis shows values from 0 to 1926.9473684210525.