Edit chart
Loading graph
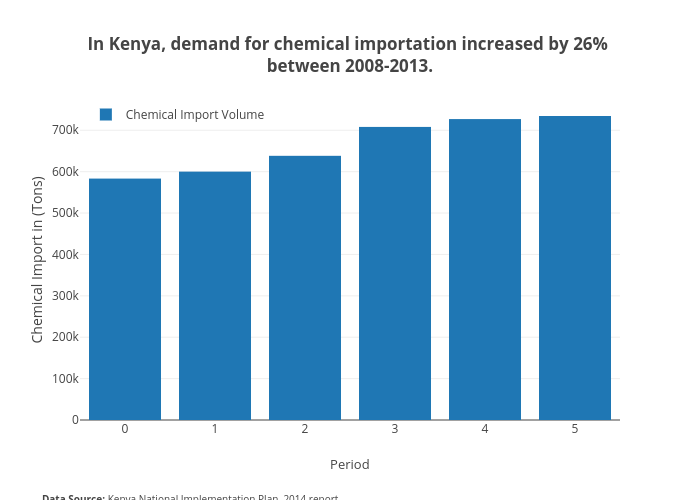
Mosemogeni's interactive graph and data of "In Kenya, demand for chemical importation increased by 26% between 2008-2013." is a bar chart, showing Chemical Import Volume; with Period in the x-axis and Chemical Import in (Tons) in the y-axis.. The x-axis shows values from -0.5 to 5.5. The y-axis shows values from 0 to 773057.8947368421. This visualization has the following annotation: Data Source; Kenya National Implementation Plan, 2014 report