Edit chart
Loading graph
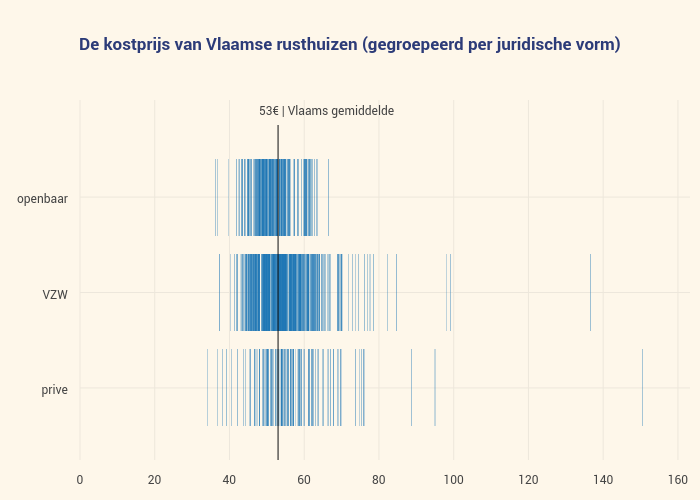
Multimediafin's interactive graph and data of "De kostprijs van Vlaamse rusthuizen (gegroepeerd per juridische vorm)" is a scatter chart, showing Col1. The x-axis shows values from 0 to 163.2340920130456. The y-axis shows values from -0.7546659381556985 to 3.0060802153372466. This visualization has the following annotation: 53€ | Vlaams gemiddelde