Edit chart
Loading graph
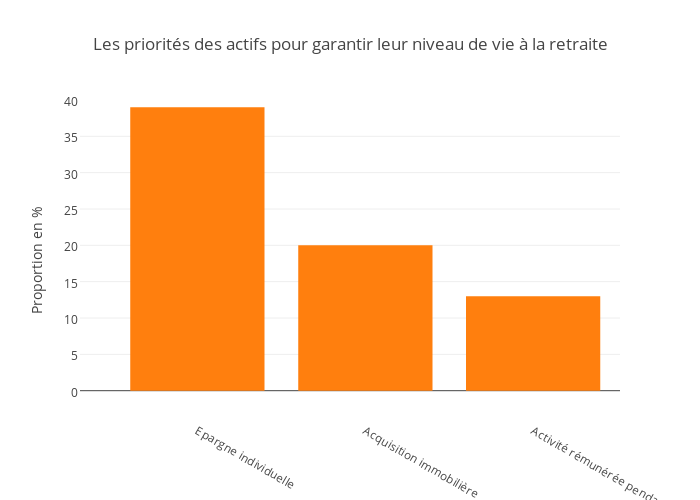
Napro's interactive graph and data of "Les priorités des actifs pour garantir leur niveau de vie à la retraite" is a bar chart, showing Col2; with Proportion en % in the y-axis. The x-axis shows values from -0.6999832523725247 to 2.5175412913901796. The y-axis shows values from -4.03237427358377 to 39.996908956853275.