Edit chart
Loading graph
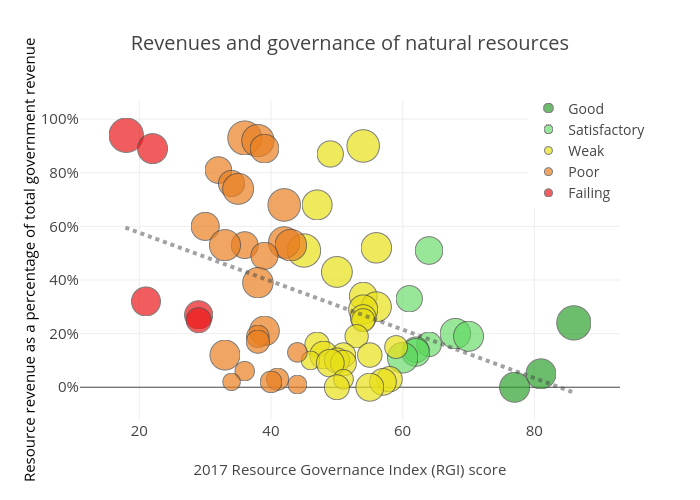
Nrgi's interactive graph and data of "Revenues and governance of natural resources" is a scatter chart, showing Good, Satisfactory, Weak, Poor, Failing, Resource revenue % total revenue; with 2017 Resource Governance Index (RGI) score in the x-axis and Resource revenue as a percentage of total government revenue in the y-axis.. The x-axis shows values from 11.854053196074767 to 92.13570148633201. The y-axis shows values from -11.310506918558868 to 106.10686163534744.