Edit chart
Loading graph
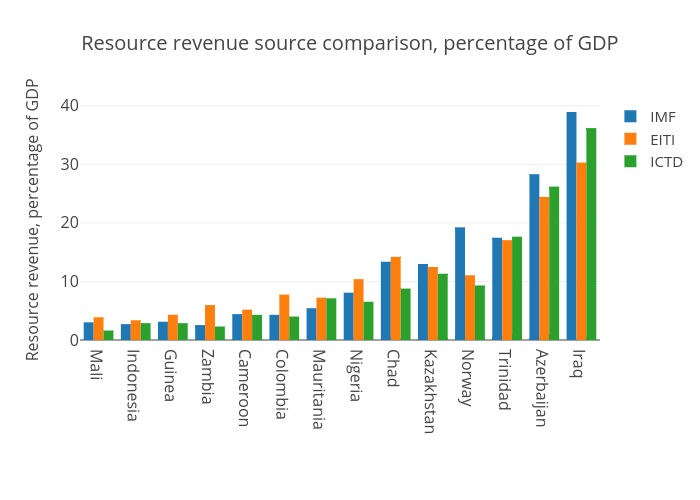
Nrgi's interactive graph and data of "Resource revenue source comparison, percentage of GDP" is a grouped bar chart, showing IMF, EITI, ICTD; with in the x-axis and Resource revenue, percentage of GDP in the y-axis.. The x-axis shows values from -0.5 to 13.5. The y-axis shows values from 0 to 40.97894736842105.