Edit chart
Loading graph
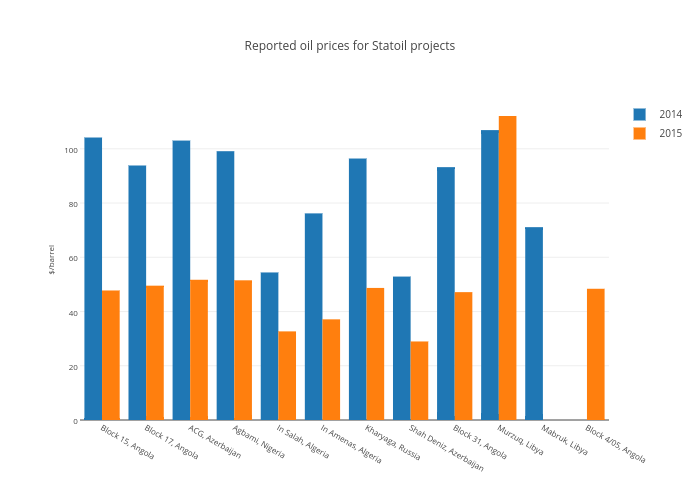
Nrgi's interactive graph and data of "Reported oil prices for Statoil projects" is a grouped bar chart, showing 2014 vs 2015; with $/barrel in the y-axis. The x-axis shows values from -0.5 to 11.5. The y-axis shows values from 0 to 118.