Edit chart
Loading graph
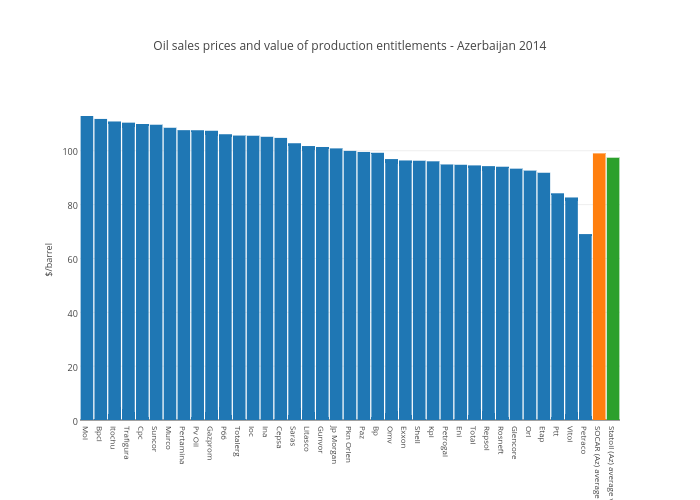
Nrgi's interactive graph and data of "Oil sales prices and value of production entitlements - Azerbaijan 2014" is a grouped bar chart, showing SOCAR (Az) oil sales price to traders, SOCAR (Az) average oil sales price, Average value reported by Statoil (Az); with $/barrel in the y-axis. The x-axis shows values from -0.5 to 38.5. The y-axis shows values from 0 to 118.86315789473684.