Edit chart
Loading graph
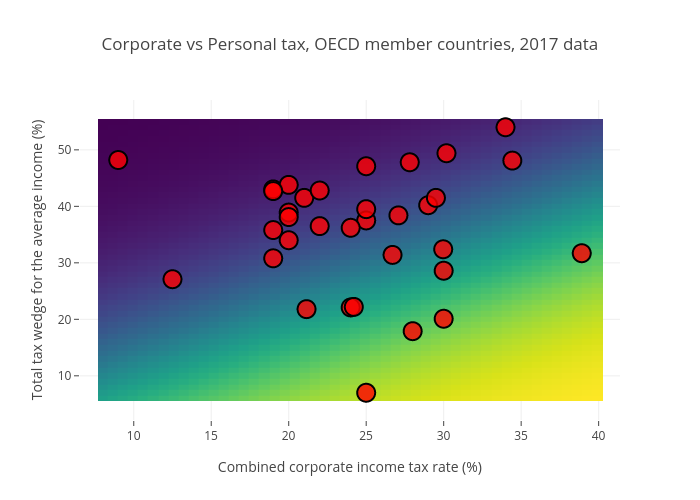
Nevernervous's interactive graph and data of "Corporate vs Personal tax, OECD member countries, 2017 data" is a scatter chart; with Combined corporate income tax rate (%) in the x-axis and Total tax wedge for the average income (%) in the y-axis.. The x-axis shows values from 0 to 0. The y-axis shows values from 0 to 0.