Edit chart
Loading graph
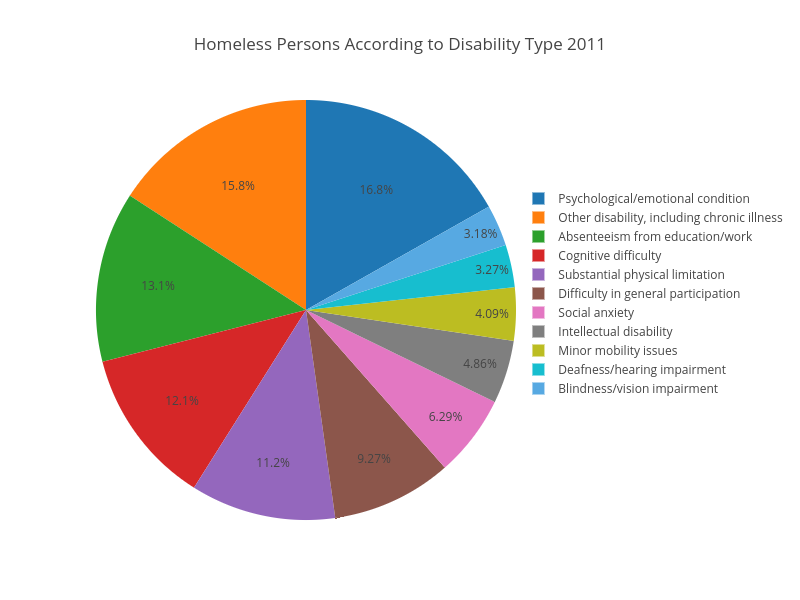
Niamhcullen's interactive graph and data of "Homeless Persons According to Disability Type 2011" is a pie, showing values. The x-axis shows values from 0 to 0. The y-axis shows values from 0 to 0.