Edit chart
Loading graph
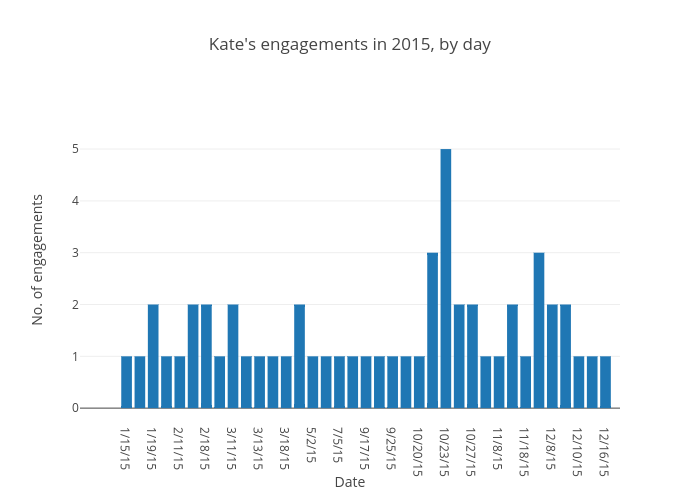
Nicktaylor-vaisey's interactive graph and data of "Kate's engagements in 2015, by day" is a bar chart, showing No. of engagements; with Date in the x-axis and No. of engagements in the y-axis.. The x-axis shows values from -3.5008800431511027 to 37.08930390400401. The y-axis shows values from -0.22929485571328478 to 5.947138465943905.