Edit chart
Loading graph
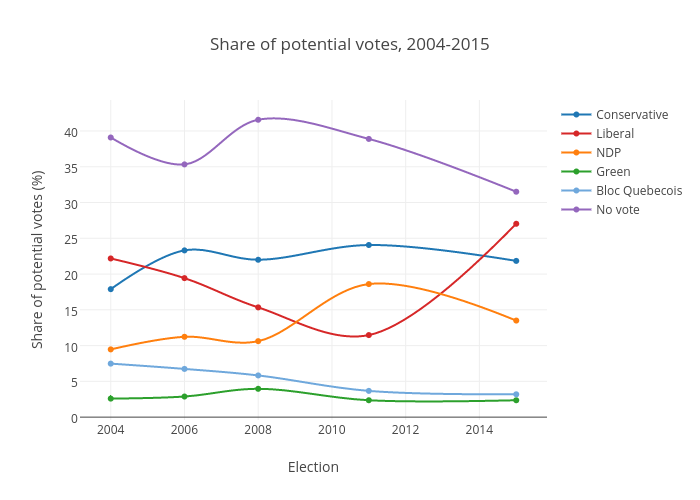
Nicktaylor-vaisey's interactive graph and data of "Share of potential votes, 2004-2015" is a line chart, showing Conservative, Liberal, NDP, Green, Bloc Quebecois, No vote; with Election in the x-axis and Share of potential votes (%) in the y-axis.. The x-axis shows values from 2003.3505891200803 to 2015.6494108799197. The y-axis shows values from -0.1809054593874837 to 44.11090545938748.