Edit chart
Loading graph
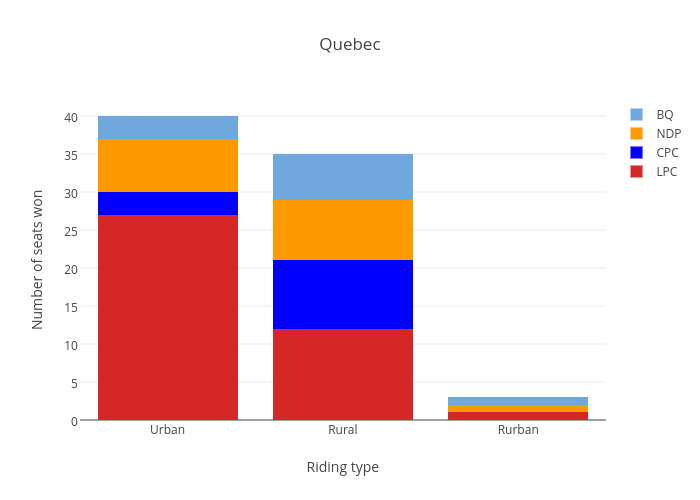
Nicktaylor-vaisey's interactive graph and data of "Quebec" is a stacked bar chart, showing LPC, CPC, NDP, BQ; with Riding type in the x-axis and Number of seats won in the y-axis.. The x-axis shows values from -0.5 to 2.5. The y-axis shows values from 0 to 42.10526315789474.