Edit chart
Loading graph
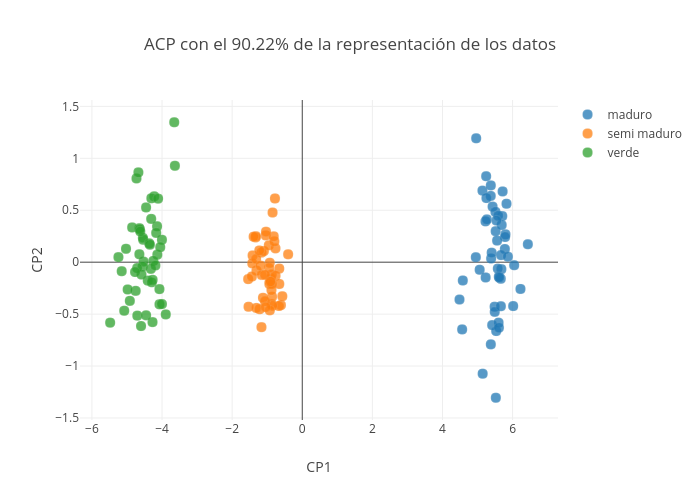
Olanoit's interactive graph and data of "ACP con el 90.22% de la representación de los datos" is a scatter chart, showing maduro, semi maduro, verde; with CP1 in the x-axis and CP2 in the y-axis.. The x-axis shows values from 0 to 0. The y-axis shows values from 0 to 0.