Edit chart
Loading graph
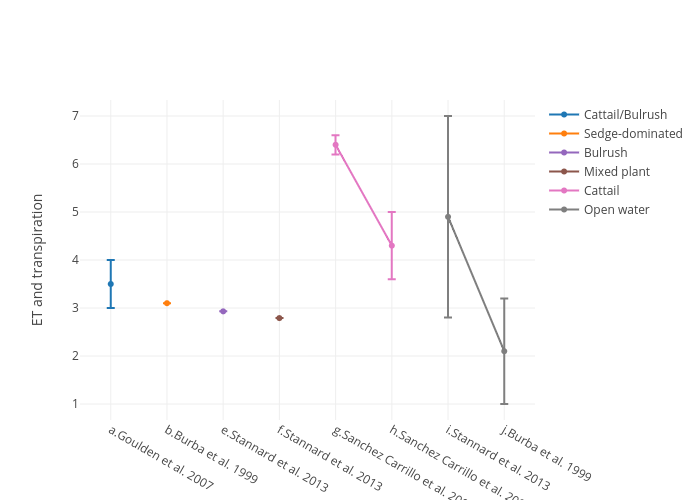
Omar2015's interactive graph and data of "Cattail/Bulrush, Sedge-dominated, wooded swam, freshwater marsh, Bulrush, Mixed plant, Cattail, Open water" is a scatter chart, showing Cattail/Bulrush, Sedge-dominated, wooded swam, freshwater marsh, Bulrush, Mixed plant, Cattail, Open water; with ET and transpiration in the y-axis. The x-axis shows values from -0.6208459214501512 to 9.620845921450151. The y-axis shows values from 0.13888888888888884 to 7.361111111111111.