Edit chart
Loading graph
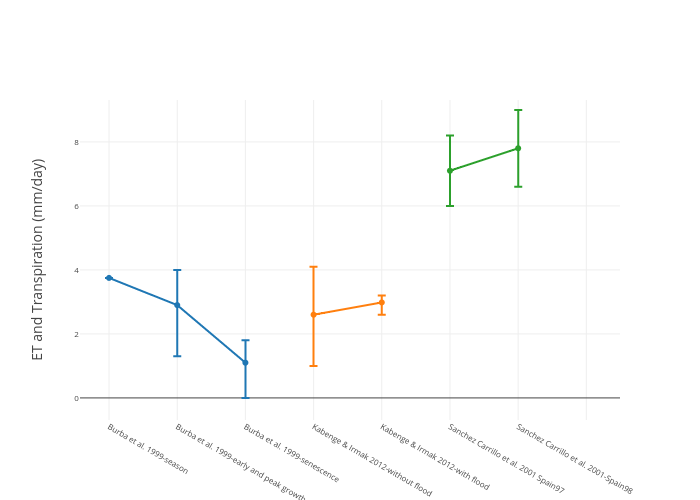
Omar2015's interactive graph and data of "2, 4, 13, Study-Num" is a scatter chart, showing 2, 4, 13, Study-Num; with ET and Transpiration (mm/day) in the y-axis. The x-axis shows values from -0.4257675538776331 to 7.493695533370685. The y-axis shows values from -0.6902085551204191 to 9.309791444879576.