Edit chart
Loading graph
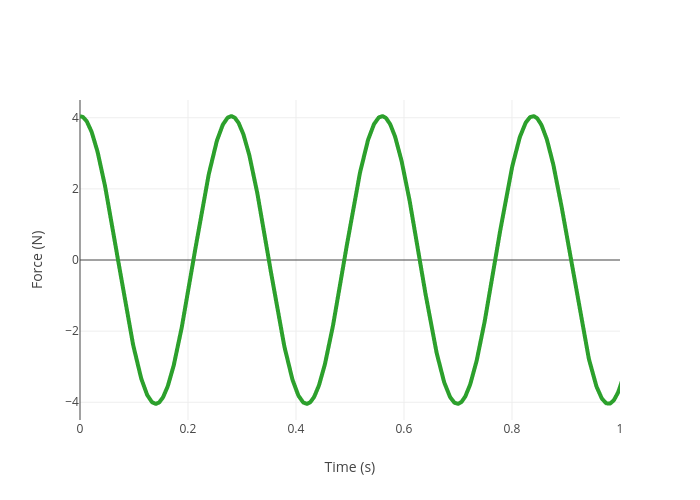
Perlatmsu's interactive graph and data of "Force (N) vs Time (s)" is a scatter chart, showing Col12; with Time (s) in the x-axis and Force (N) in the y-axis.. The x-axis shows values from 0 to 1. The y-axis shows values from -4.5 to 4.5.