Edit chart
Loading graph
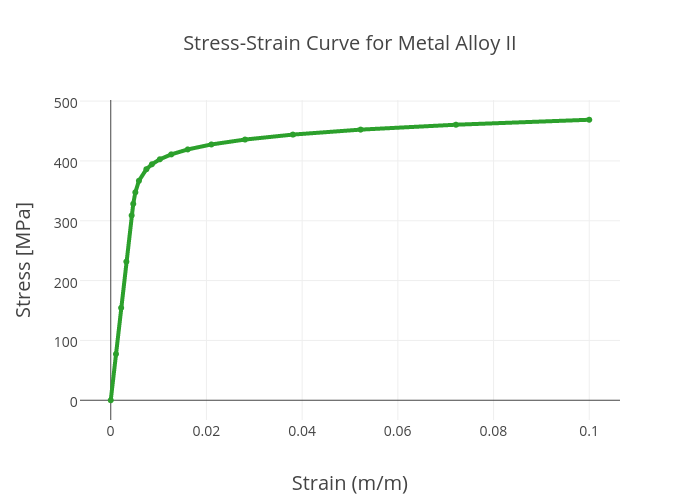
Perlatmsu's interactive graph and data of "Stress-Strain Curve for Metal Alloy II" is a scatter chart, showing Col1; with Strain (m/m) in the x-axis and Stress [MPa] in the y-axis.. The x-axis shows values from -0.006045118082481496 to 0.1060451180824815. The y-axis shows values from -29.97865055387714 to 498.7786505538771.