Edit chart
Loading graph
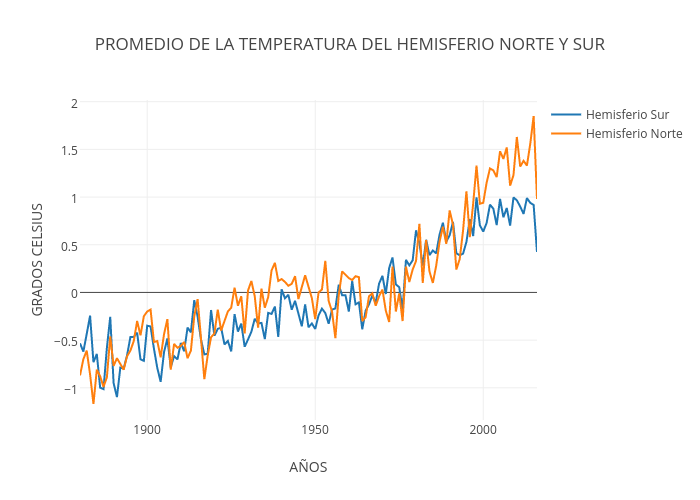
Pamelacalderoncal's interactive graph and data of "PROMEDIO DE LA TEMPERATURA DEL HEMISFERIO NORTE Y SUR " is a scatter chart, showing Hemisferio Sur vs Hemisferio Norte; with AÑOS in the x-axis and GRADOS CELSIUS in the y-axis.. The x-axis shows values from 1880 to 2016. The y-axis shows values from -1.3377777777777777 to 2.017777777777778.