Edit chart
Loading graph
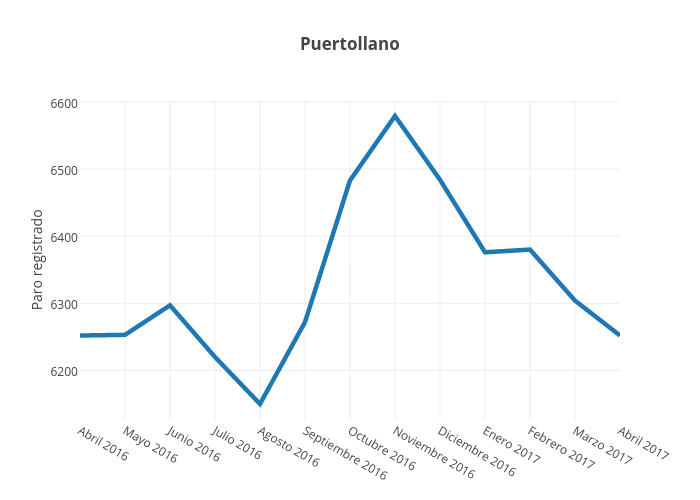
Paquitabravo's interactive graph and data of "Puertollano" is a line chart, showing B; with Paro registrado in the y-axis. The x-axis shows values from 0 to 12. The y-axis shows values from 6126.166666666667 to 6602.833333333333.