Edit chart
Loading graph
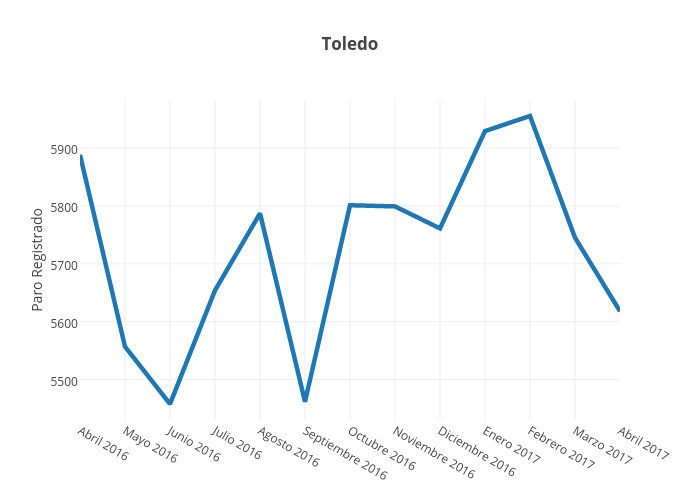
Paquitabravo's interactive graph and data of "Toledo" is a line chart, showing B; with Paro Registrado in the y-axis. The x-axis shows values from 0 to 12. The y-axis shows values from 5430.388888888889 to 5982.611111111111.