Edit chart
Loading graph
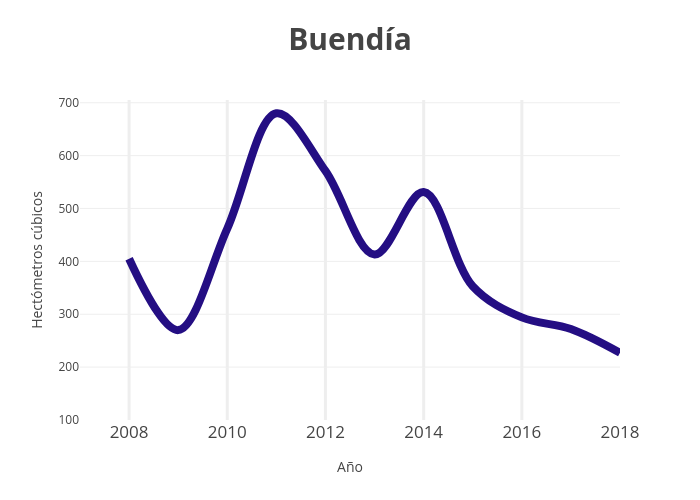
Paquitabravo's interactive graph and data of "Buendía" is a line chart, showing B; with Año in the x-axis and Hectómetros cúbicos in the y-axis.. The x-axis shows values from 2007 to 2018. The y-axis shows values from 100 to 705.1666666666661.