Edit chart
Loading graph
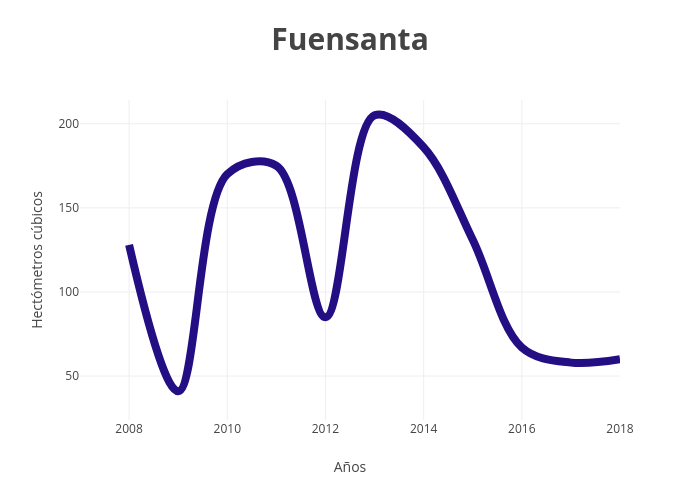
Paquitabravo's interactive graph and data of "Fuensanta" is a line chart, showing B; with Años in the x-axis and Hectómetros cúbicos in the y-axis.. The x-axis shows values from 2007 to 2018. The y-axis shows values from 23.88888888888889 to 214.11111111111111.