Edit chart
Loading graph
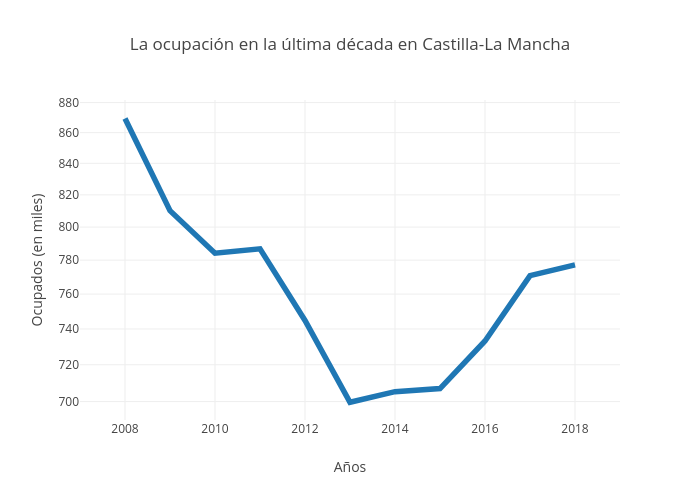
Paquitabravo's interactive graph and data of "La ocupación en la última década en Castilla-La Mancha" is a line chart, showing A; with Años in the x-axis and Ocupados (en miles) in the y-axis.. The x-axis shows values from 2007 to 2019. The y-axis shows values from 2.838957475995205 to 2.9453345229353842.