Edit chart
Loading graph
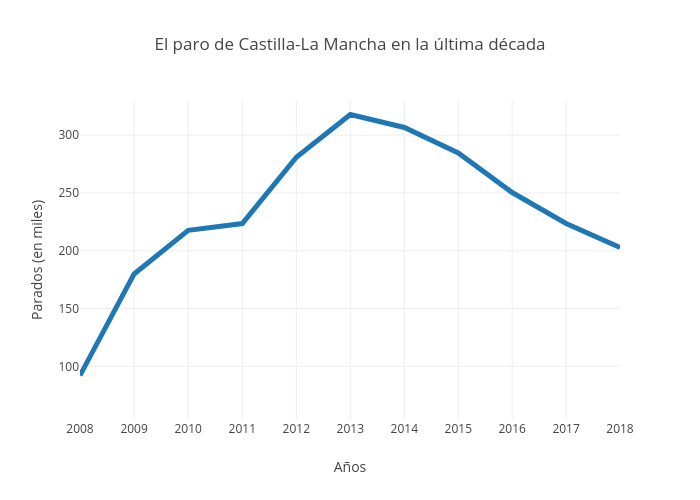
Paquitabravo's interactive graph and data of "El paro de Castilla-La Mancha en la última década" is a line chart, showing A; with Años in the x-axis and Parados (en miles) in the y-axis.. The x-axis shows values from 3.3027637084729813 to 3.304921161900891. The y-axis shows values from 53.5611111111111 to 330.3388888888889.