Edit chart
Loading graph
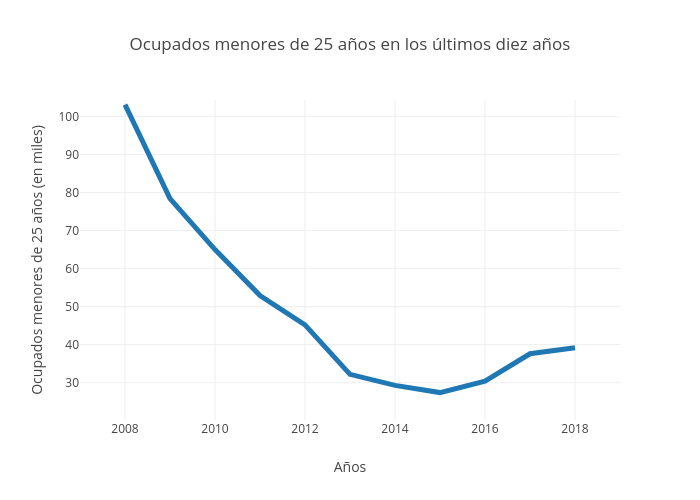
Paquitabravo's interactive graph and data of "Ocupados menores de 25 años en los últimos diez años" is a line chart, showing A; with Años in the x-axis and Ocupados menores de 25 años (en miles) in the y-axis.. The x-axis shows values from 2007 to 2019. The y-axis shows values from 20.194444444444443 to 104.30555555555554.