Edit chart
Loading graph
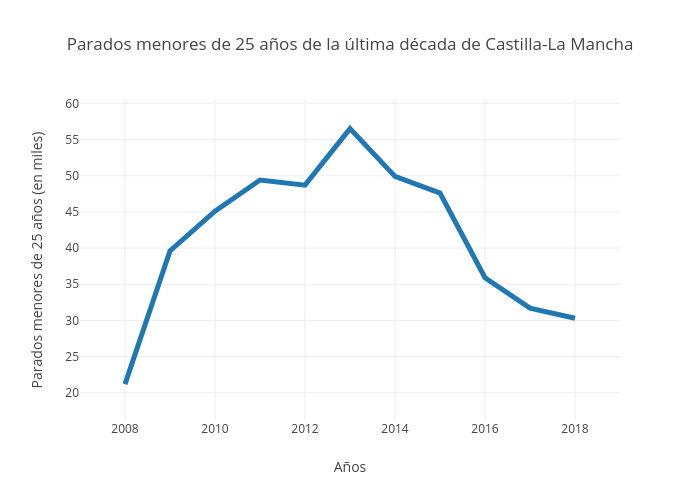
Paquitabravo's interactive graph and data of "Parados menores de 25 años de la última década de Castilla-La Mancha" is a line chart, showing A; with Años in the x-axis and Parados menores de 25 años (en miles) in the y-axis.. The x-axis shows values from 2007 to 2019. The y-axis shows values from 16.238888888888887 to 60.46111111111111.