Edit chart
Loading graph
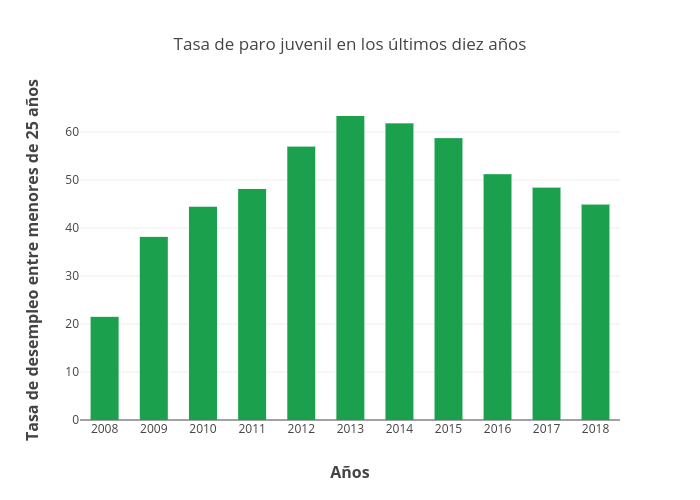
Paquitabravo's interactive graph and data of "Tasa de paro juvenil en los últimos diez años" is a bar chart, showing B; with Años in the x-axis and Tasa de desempleo entre menores de 25 años in the y-axis.. The x-axis shows values from 3.3026555539507183 to 3.305028753746333. The y-axis shows values from 0 to 66.66315789473684.