Edit chart
Loading graph
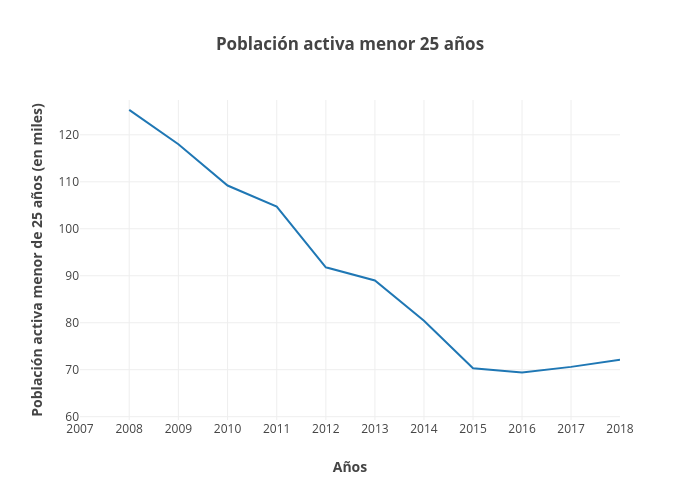
Paquitabravo's interactive graph and data of "Población activa menor 25 años" is a line chart, showing B; with Años in the x-axis and Población activa menor de 25 años (en miles) in the y-axis.. The x-axis shows values from 3.302547372487485 to 3.3049211619008907. The y-axis shows values from 59.29444444444444 to 127.40555555555542.