Edit chart
Loading graph
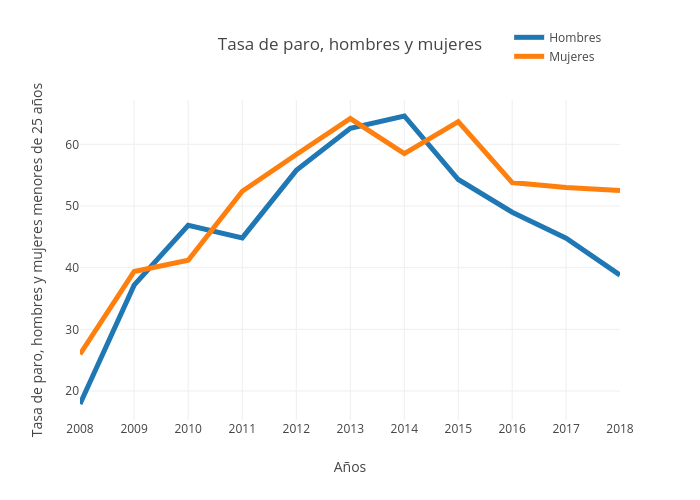
Paquitabravo's interactive graph and data of "Tasa de paro, hombres y mujeres" is a line chart, showing Hombres vs Mujeres; with Años in the x-axis and Tasa de paro, hombres y mujeres menores de 25 años in the y-axis.. The x-axis shows values from 3.3027637084729813 to 3.304921161900891. The y-axis shows values from 15.295000000000002 to 67.195.