Edit chart
Loading graph
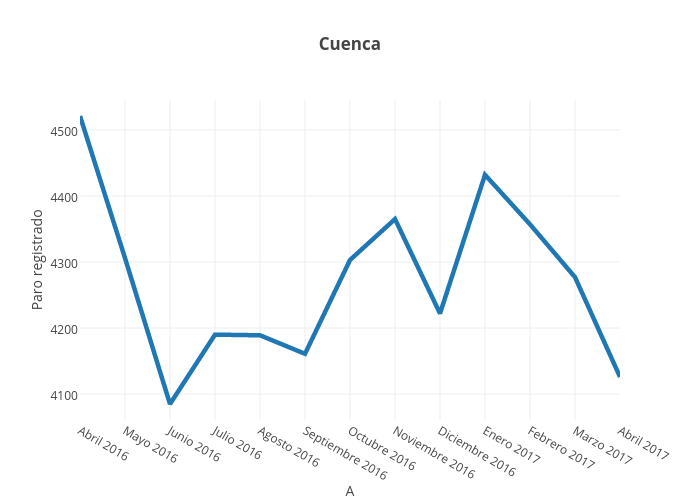
Paquitabravo's interactive graph and data of "Cuenca" is a line chart, showing B; with A in the x-axis and Paro registrado in the y-axis.. The x-axis shows values from 0 to 12. The y-axis shows values from 4060.777777777778 to 4545.222222222223.