Edit chart
Loading graph
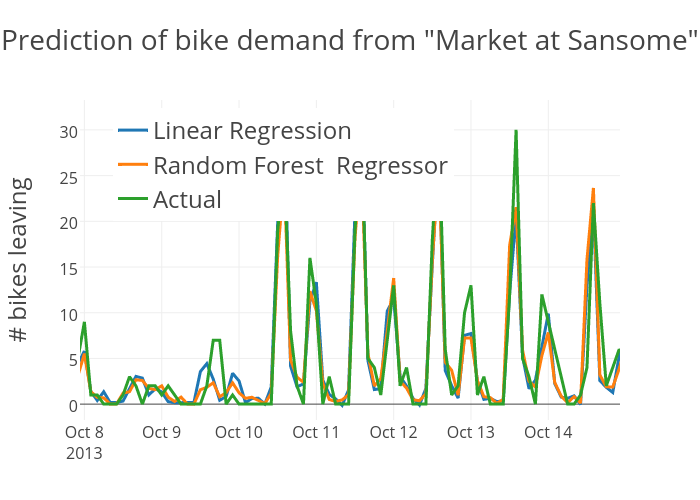
Patrickmerlot's interactive graph and data of "Prediction of bike demand from "Market at Sansome"" is a scatter chart, showing Linear Regression, Random Forest Regressor, Actual ; with # bikes leaving in the y-axis. The x-axis shows values from 1381185486458.4438 to 1381788909029.2292. The y-axis shows values from -1.7368796209289394 to 33.27003381314874.