Edit chart
Loading graph
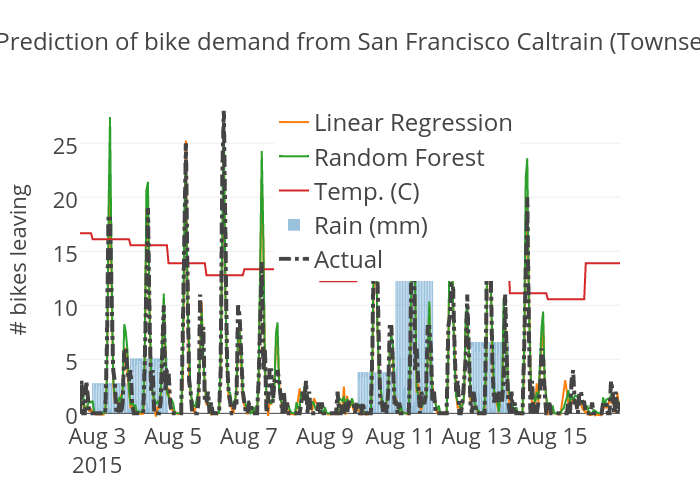
Patrickmerlot's interactive graph and data of "cityBikes/Prediction of bike demand from San Francisco Caltrain (Townsend at 4th)" is a scatter chart, showing Linear Regression, Random Forest, Temp. (C), Rain (mm), Actual; with # bikes leaving in the y-axis. The x-axis shows values from 1438520400000 to 1439750377087.303. The y-axis shows values from -0.6151256549816668 to 28.99753609590161.