Edit chart
Loading graph
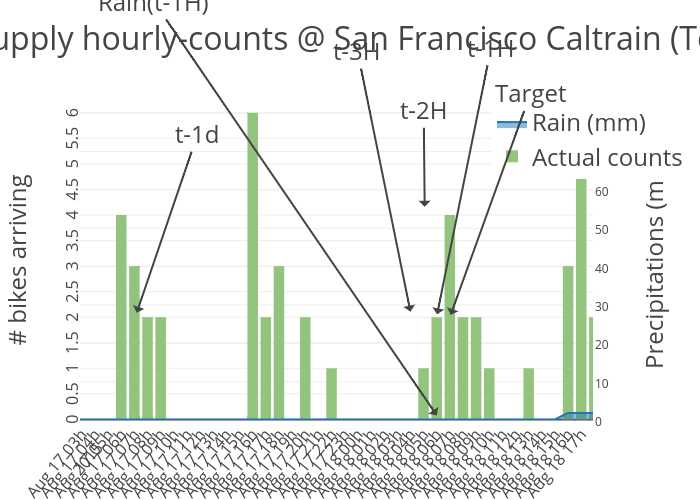
Patrickmerlot's interactive graph and data of "cityBikes/Bike supply hourly-counts @ San Francisco Caltrain (Townsend at 4th)" is a scatter chart, showing Rain (mm) vs Actual counts; with # bikes arriving in the y-axis. The x-axis shows values from 1439779899252.1487 to 1439920420357.0583. The y-axis shows values from -0.012136255329360468 to 6.25067617058492. This visualization has the following annotations: Target; t-1h; t-2h; t-3h; t-1d; t-1d; t-3H; t-2H; t-1H; Target; Rain(t-1H)