Edit chart
Loading graph
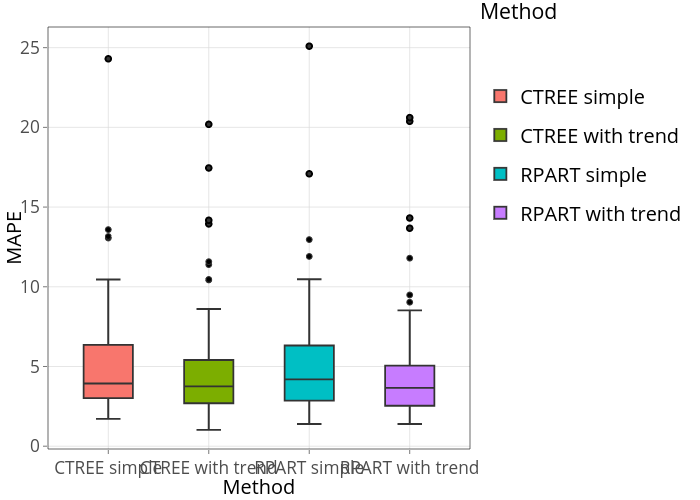
Petolau2's interactive graph and data of "MAPE vs Method" is a box plot, showing CTREE simple, CTREE with trend, RPART simple, RPART with trend; with Method in the x-axis and MAPE in the y-axis.. The x-axis shows values from 0.4 to 4.6. The y-axis shows values from -0.176560042543162 to 26.2958944687532. This visualization has the following annotation: Method