Edit chart
Loading graph
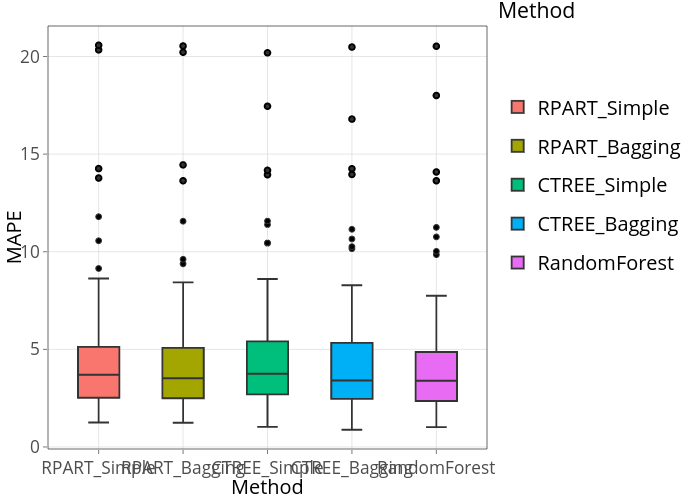
Petolau2's interactive graph and data of "MAPE vs Method" is a box plot, showing RPART_Simple, RPART_Bagging, CTREE_Simple, CTREE_Bagging, RandomForest; with Method in the x-axis and MAPE in the y-axis.. The x-axis shows values from 0.4 to 5.6. The y-axis shows values from -0.104881598460728 to 21.563570491113. This visualization has the following annotation: Method