Edit chart
Loading graph
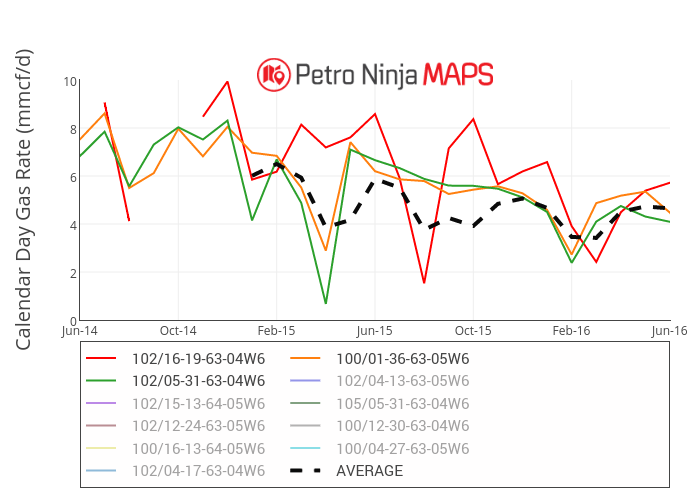
Petroninja's interactive graph and data of "Calendar Day Gas Rate (mmcf/d) vs Month" is a line chart, showing 102/16-19-63-04W6 , 100/01-36-63-05W6, 102/05-31-63-04W6, 102/04-13-63-05W6, 102/15-13-64-05W6, 105/05-31-63-04W6, 102/12-24-63-05W6, 100/12-30-63-04W6, 100/16-13-64-05W6, 100/04-27-63-05W6, 102/04-17-63-04W6, AVERAGE; with Month in the x-axis and Calendar Day Gas Rate (mmcf/d) in the y-axis.. The x-axis shows values from 8 to 32. The y-axis shows values from 0 to 10.