Edit chart
Loading graph
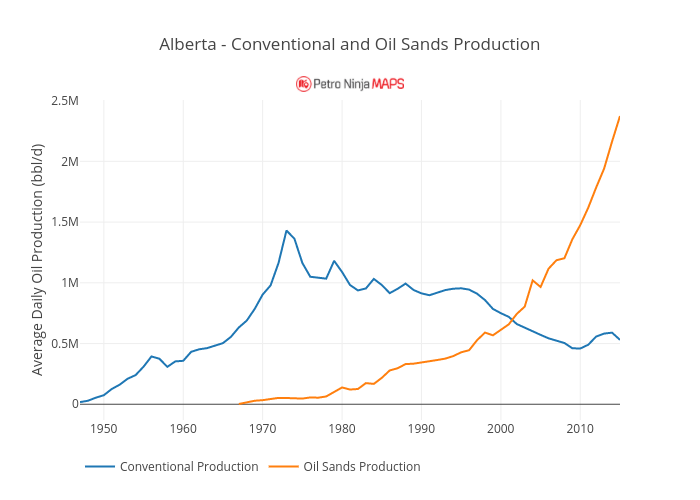
Petroninja's interactive graph and data of "Alberta - Conventional and Oil Sands Production" is a line chart, showing Conventional Production vs Oil Sands Production; with Average Daily Oil Production (bbl/d) in the y-axis. The x-axis shows values from 1947 to 2015. The y-axis shows values from -131985.65725227384 to 2507276.657252274.