Edit chart
Loading graph
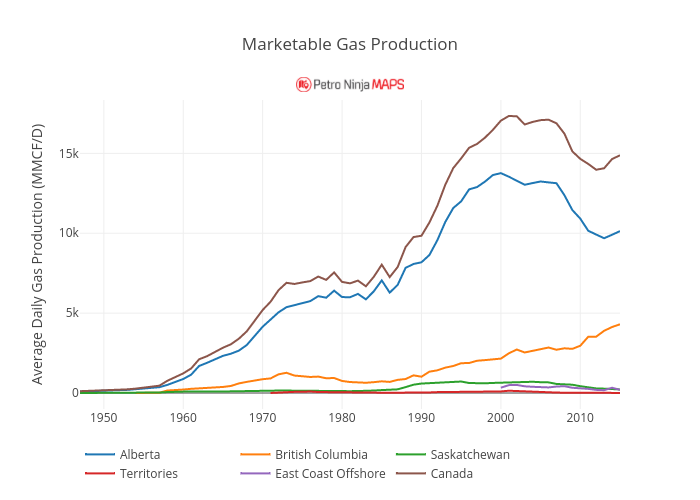
Petroninja's interactive graph and data of "Marketable Gas Production" is a line chart, showing Alberta, British Columbia, Saskatchewan, Territories, East Coast Offshore, Canada; with Average Daily Gas Production (MMCF/D) in the y-axis. The x-axis shows values from 1947 to 2015. The y-axis shows values from -979.2464023045666 to 18319.039907327566.