Edit chart
Loading graph
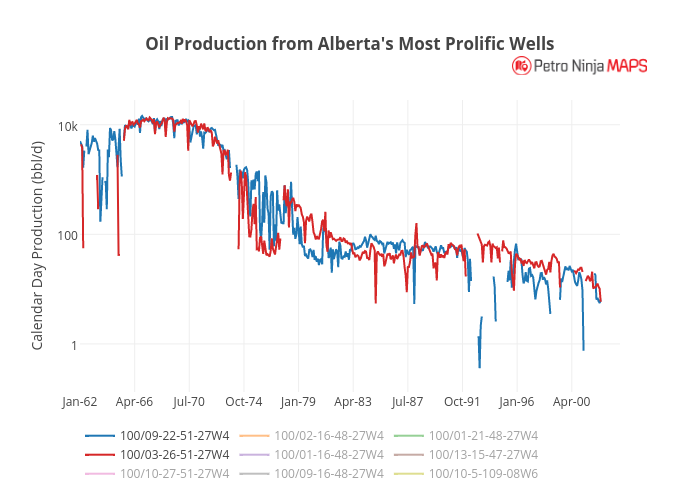
Petroninja's interactive graph and data of "Oil Production from Alberta's Most Prolific Wells" is a line chart, showing 100/09-22-51-27W4, 100/02-16-48-27W4, 100/01-21-48-27W4, 100/03-26-51-27W4, 100/01-16-48-27W4, 100/13-15-47-27W4, 100/10-27-51-27W4, 100/09-16-48-27W4, 100/10-5-109-08W6; with Calendar Day Production (bbl/d) in the y-axis. The x-axis shows values from 0 to 504. The y-axis shows values from -0.848606408571412 to 4.422988722273189.