Edit chart
Loading graph
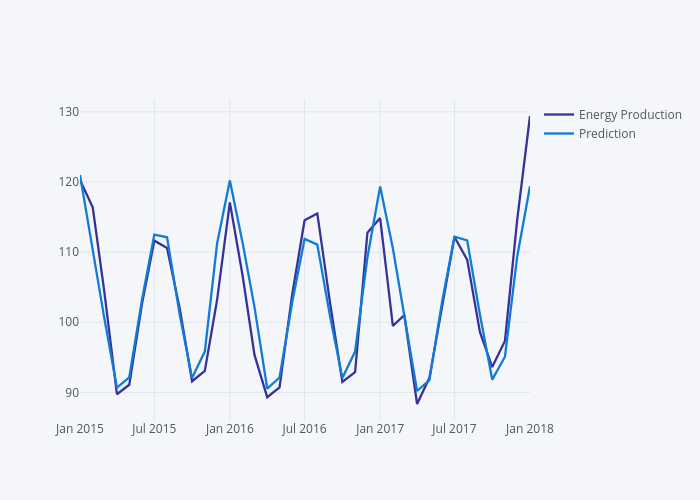
Pierian-data's interactive graph and data of "Energy Production vs Prediction" is a line chart, showing Energy Production vs Prediction. The x-axis shows values from 2015-01-01 to 2018-01-01. The y-axis shows values from 86.07234444444444 to 131.68545555555556.