Edit chart
Loading graph
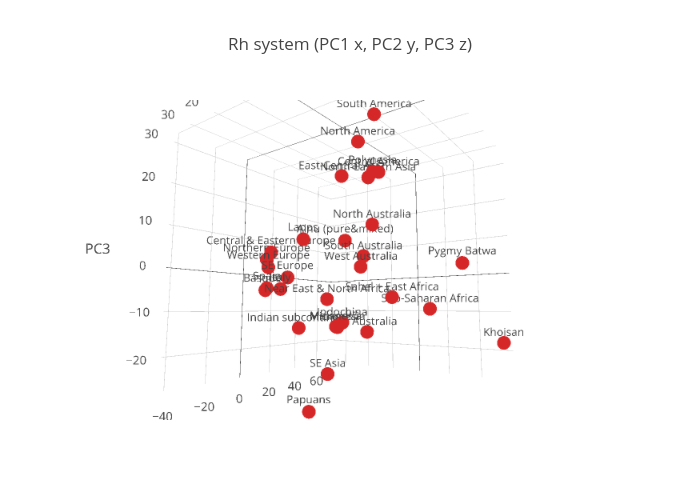
Portalantropologiczny's interactive graph and data of "Rh system (PC1 x, PC2 y, PC3 z)" is a scatter3d, showing PC3. The x-axis shows values from 0 to 0. The y-axis shows values from 0 to 0.