Edit chart
Loading graph
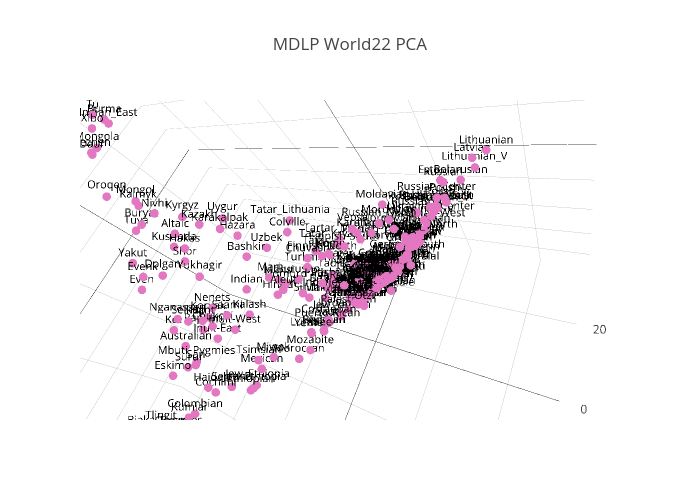
Portalantropologiczny9cfa's interactive graph and data of "MDLP World22 PCA" is a scatter3d, showing D; with B in the x-axis and C in the y-axis.. The x-axis shows values from 0 to 0. The y-axis shows values from 0 to 0.