Edit chart
Loading graph
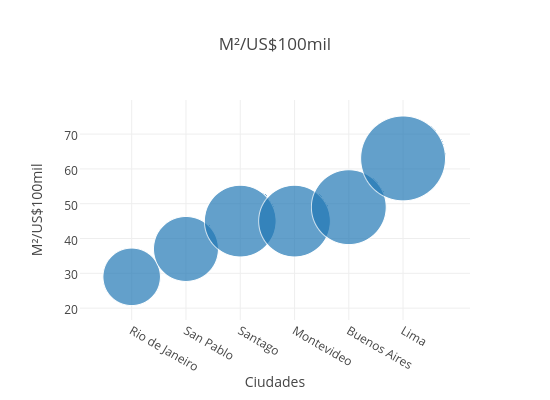
Properati's interactive graph and data of "M²/US$100mil" is a scatter chart, showing M²/US$100mil; with Ciudades in the x-axis and M²/US$100mil in the y-axis.. The x-axis shows values from -0.9522050809933104 to 6.233203369538137. The y-axis shows values from 16.597868357838546 to 79.78244543823828.