Edit chart
Loading graph
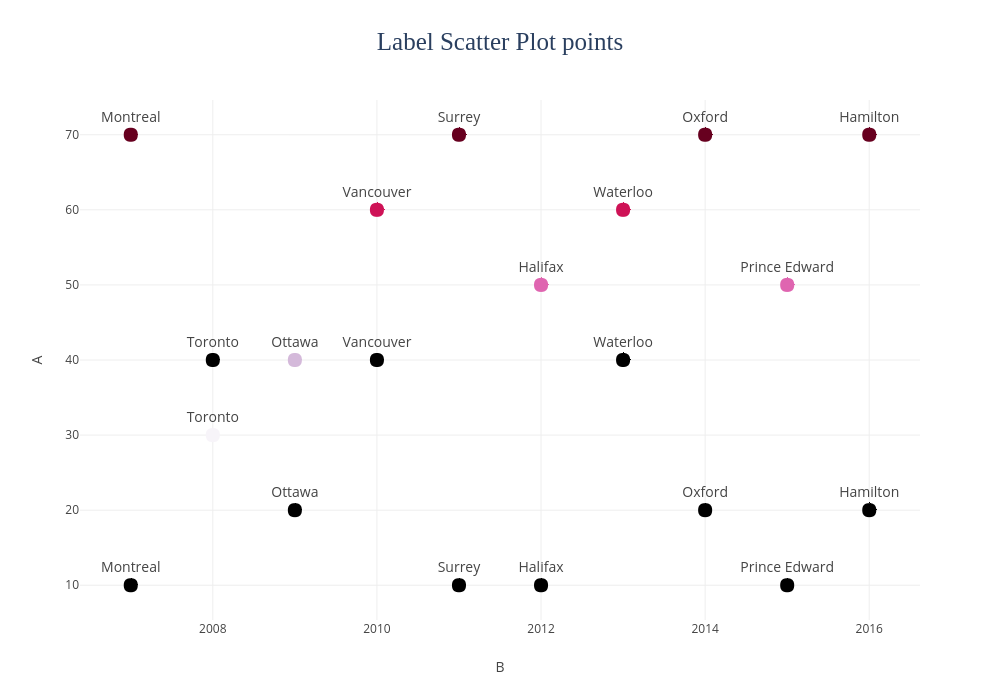
Pythonplotbot's interactive graph and data of "Label Scatter Plot points" is a , showing B vs C; with B in the x-axis and A in the y-axis.. The x-axis shows values from 2006.3815165876777 to 2016.6184834123223. The y-axis shows values from 5.37180910099889 to 74.62819089900111.