Edit chart
Loading graph
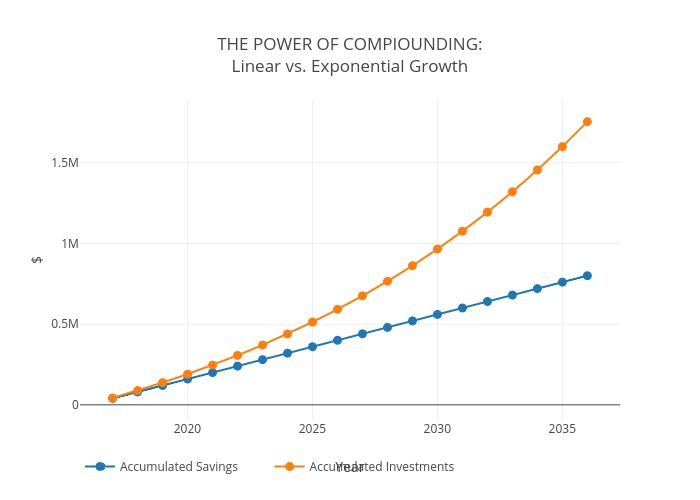
Rae.plutus.normative's interactive graph and data of "THE POWER OF COMPIOUNDING:Linear vs. Exponential Growth" is a line chart, showing Accumulated Savings vs Accumulated Investments; with Year in the x-axis and $ in the y-axis.. The x-axis shows values from 2015.7321444533834 to 2037.2678555466166. The y-axis shows values from -98009.96464093358 to 1892617.0346409336.