Edit chart
Loading graph
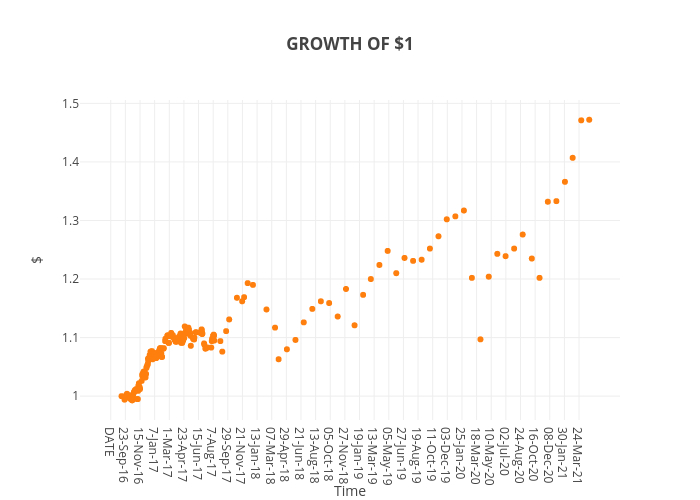
Rae.plutus.normative's interactive graph and data of "GROWTH OF $1" is a scatter chart, showing y; with Time in the x-axis and $ in the y-axis.. The x-axis shows values from -102.54749500738042 to 1835.5474950073803. The y-axis shows values from 0.957212643678161 to 1.5077873563218391.