Edit chart
Loading graph
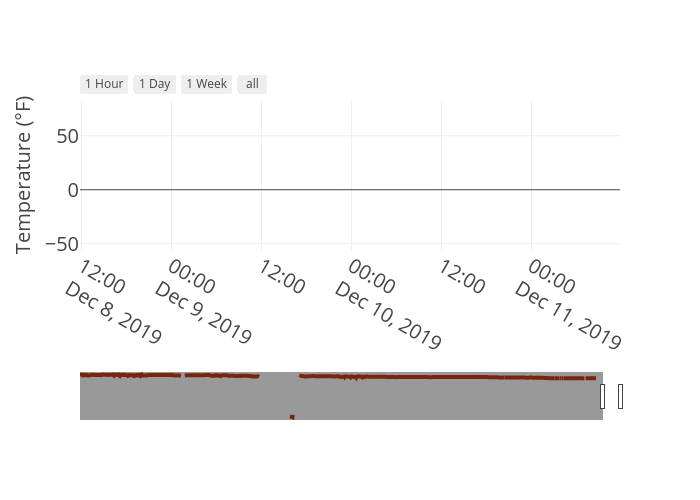
Ribplotly's interactive graph and data of "Temperature (°F) vs {'font': {'size': 20}}" is a scatter chart; with {'font': {'size': 20}} in the x-axis and Temperature (°F) in the y-axis.. The x-axis shows values from 2019-12-08 11:48:00 to 2019-12-11 11:48:00. The y-axis shows values from 0 to 0.