Edit chart
Loading graph
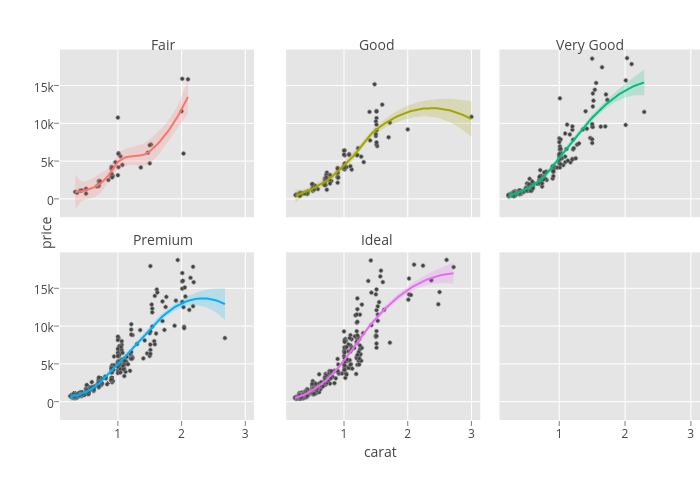
Rplotbot's interactive graph and data of "None, None, None, None, None, Fair, Good, Very Good, Premium, Ideal, Fair, Good, Very Good, Premium, Ideal" is a scatter chart, showing None, None, None, None, None, Fair, Good, Very Good, Premium, Ideal, Fair, Good, Very Good, Premium, Ideal. The x-axis shows values from 0.0915 to 3.1385. The y-axis shows values from -2424.94920630485 to 19760. This visualization has the following annotations: Fair; Good; Very Good; Premium; Ideal; carat; price